
In Part 1 we saw that Edmonton reliably gets some mild temperatures in the middle of winter. And in Part 2 we saw that whether you actually want to call them "chinooks" or not, Edmonton gets about half of what Calgary does, and a lot more than Winnipeg.
Today we're going to take a different approach, and see what happens to the temperatures in Edmonton when Calgary gets a chinook.
Calgary Winter Temperatures

Here are Calgary's daily high temperatures for December-February for the last 5 years. Highs above freezing are in orange, and below freezing are in blue. In our other looks at chinooks I had been using data that went all the way back to the 1880s, but today we're going to stick with recent history because otherwise things get very complicated.
Now lets take a look at the chinooks:
Calgary Chinooks
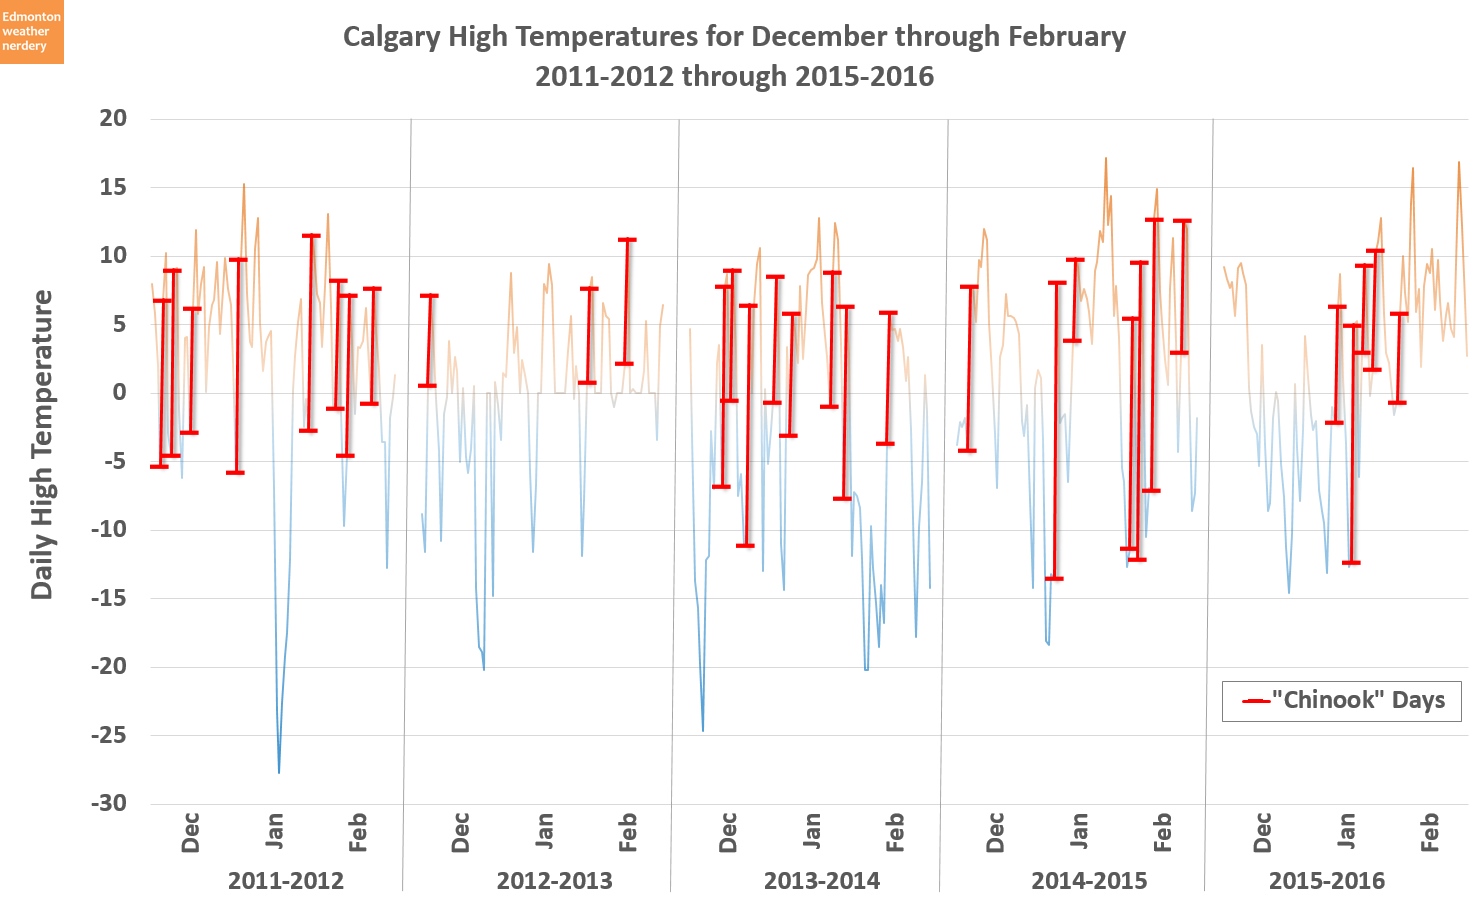
Here the daily temperatures are still in the background, and the red lines show each time that Calgary had a chinook. We've looked at a few different ways to quantity a chinook, and today I'm just going to focus on one of them:
- days with a high of at least 5°C and a day-over-day increase of at least 5°C.
Just for a little bit of context, this week both Calgary and Edmonton are emerging from an early-December deepfreeze, but right now neither city has any temperatures above 5°C in the forecast. So even though both cities will have swung from below -20°C to above freezing, it won't actually count as a chinook unless we warm up a little bit more than expected.
For these past 5 winters then, Calgary had 31 of these chinook events. And we can see that some of them had temperature swings right around the 5°C minimum, whereas others were almost 20°C. 2011-2012 and 2013-2014 each had 8 of these events, while 2012-2013 only 3 events, although the number of events doesn't necessarily relate to how long each event lasted, or how warm things actually got.
Now lets take a look at what happened in Edmonton while Calgary was warming up:
Edmonton Temperatures During Chinooks

This isn't a great chart, but it's one step on the way to a better one, so we won't spend too here before moving on.
Here we've added the temperatures for Edmonton each time that Calgary has a chinook. The lines in orange are days when Edmonton warmed up, and blue are days when Edmonton got colder. Of the 31 Calgary chinooks, Edmonton cooled off only 4 times, and warmed up the other 27.
To make things easier to read we're going to get rid of all the non-chinook days, and just focus on the days that Calgary's temperature jumps up:
Temperature Changes

Here is the same data as the last chart, but now we're just looking at the temperatures at the start of the Calgary chinooks. I think this makes it a little easier to see what's going on.
The 4 days that Edmonton cooled off are still in blue, and the days with warming are in orange. Of those warm days in orange, we can see that Edmonton had some pretty substantial temperature increases, as well as some tiny little ones.
One thing that we didn't talk about last week, is that Edmonton is quite a bit further from the mountains than Calgary is. So maybe it takes longer for the warm air to get here? Instead of just looking at the one-day temperature increase, today I'd like to add a second day into the mix as well, to see what happens over 48 hours.
Temperature Changes over 48 Hours

Here is same data that we were just looking at, but now the second day of each chinook has been added as a lighter line. In some cases Day 2 is actually colder than Day 1, and those aren't shown - this is the maximum high temperature swing for both cities over 48 hours.
One thing to notice is that now there's only one blue line, because for these 31 Calgary chinooks Edmonton's temperature only dropped once over 48 hours. If we look at the last chinook in the chart as example - February 4th, 2015-2016 - we can see that on Day 1 Edmonton's temperature fell from -1°C to -4°C, but then on Day 2 it jumped up by 10°C to reach 6°C. That sort of thing is why I was interested in looking at a 48-hour window, instead of just 24.
So here we can see a number of large temperature swings for Calgary and Edmonton, but it's a little tough to compare everything because all of the starting and ending temperatures are different.
48-Hour Temperature Increase

Here the temperature swings from the previous chart have all be given them all the same starting point of 0. So now instead of looking at where the temperature started and ended on those days, this just show us how much the temperature increased.
Lining things up like this makes it easier to see how Calgary's chinooks compare to one another, and how Edmonton's temperature change compared to Calgary's. The Calgary chinooks vary from a minimum temperature swing of 7°C, all the way up to three with swings of 21°C. Edmonton also had two days with swings above 20°C, but then there's also one around the 1°C mark, and the one day that got colder.
When we group these all together we end up with this:

For the 31 Calgary chinooks that we've been looking at from the last 5 winters, when Calgary's temperature jumped up Edmonton's usually did too.
About 80% of the time Edmonton warmed up by at least half as much as Calgary did. Of these 31 chinooks there were only 6 when Edmonton's increase was less than half of Calgary's, but that's balanced against the 5 where Edmonton's temperature increased more than Calgary's.
So even if we don't get a full chinook, it seems like a lot of the time we maybe get an echo.
And after all of that, we finally get to our last set of charts for today:
Chinook Echoes

The previous chart we looked at showed how much Edmonton's temperature changes relative to Calgary's. That's handy, because now we know that when Calgary warms up for a chinook we usually warm up too - so we should be cheering on our southern neighbours, because we get some of the benefit. But that chart didn't tell us where Edmonton's temperature actually ended up, so that's what we have here.
This chart shows the same 31 recent chinooks that we've been looking at. Up-and-down is Edmonton's highest temperature in the 48-hour period, and right-to-left is how Edmonton's temperature jump compared to Calgary's.
Anything in the upper-right part of the chart is pretty good, because it means that our temperature jumped up as-much-or-more than Calgary's did, and the temperature also reached above 5°C. We also see some days where our temperature jump was similar to Calgary's, but where we only reached 0°C or 2°C. And then there are the days when there's not much going on, because we're stuck down around -5°C or -10°C.
Now lets look at the same chart, but this time including all of recorded history:

Here we have what happened to Edmonton temperatures when Calgary had a chinook, for all the chinooks going back to 1880.
In the chart I've broken things into four (somewhat arbitrary) groups:
- What I am going to call "chinooks", where Edmonton warmed up by at least 75% as much as Calgary did, and our temperature broke 5°C
- Chinook echoes, where we either warmed up by at least half as much as Calgary did, or we only ended up between 0°C and 5°C.
- Days where we didn't see much of a temperature change compared to Calgary, but it was still above freezing (and in many cases above 5°C).
- And then there are all the rest, where we didn't see much of a jump or it stayed pretty cool.
But today what we've seen is that when Calgary does get chinook-like temperatures:
- 30% of the time Edmonton sees something similar
- 33% of the time we get a weaker echo
- 11% of the time we're pretty warm anyway
- and for the remaining 27% we may or may not warm up, but we don't break freezing.
Calgary and southern Alberta celebrate their chinooks, and I think we've seen that Edmonton could do a bit of that too, if we were so inclined. Personally, I'm already looking forward to the chinooks and chinook-echoes that we'll see over the next few months.
This brings us to the end of Edmonton Weather Nerdery's epic look at whether-or-not Edmonton gets chinooks.
Nice break down! Be neat to see a direct temperature comparison! Weather channel says that the averages over winter in Calgary are only a few degrees colder than Edmonton. So with all the chinooks they get but averages are still fairly similar, are their colder days the same as Edmonton's? How many are colder?
ReplyDelete