I think that most people in Alberta will be familiar with the term "chinook", but I never know how widely known it is elsewhere? I won't copy the entire wikipedia entry, but the name is a reference to the Chinook people from what is now Oregon and Washington, and a chinook is when air from the west coast spills over the Rockies bringing dry, windy and unseasonably warm winter weather.
The sourthern part of Alberta up through Calgary is famous for chinooks, with temperatures swinging from below freezing to above 15°C in a few hours. That leads to folklore like:
A man rode his horse to church, only to find snowdrifts piled so high that only the steeple stuck out of the snow. So he tied his horse to the steeple with the other horses, and used a snow tunnel to get into the church. Upon his return a few hours later all the snow had melted, leaving the unfortunate horses dangling from the church steeple.That story honestly poses more questions than it answers, but my question is: does Edmonton get chinooks? We don't often see winter temperatures as high as 15°C, but we do certainly see 5°C and even 10°C. Since we're further from the mountains maybe we get baby-chinooks, or chinook-echos?
Just as a caveat, I'm not going to look at the actual mechanism of chinooks, or whether coastal air really does make it's way all the way to Edmonton. I'm just going to look at temperatures to see how often we get changes that could be maybe considered chinook-like.
Today is Part 1 and (spoilers) there won't be any answers. Those will have to wait until Part 2.
To get started, exactly how warm do temperatures have be to qualify as a chinook? Googling around, I can't find an easy answer, so we're going to look at a few approaches.
Warm Days
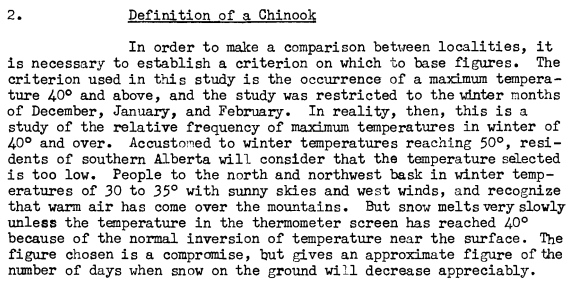
I found this 50-year-old study online which I'm going to use as a starting point: Richmond W. Longley (1967) The frequency of winter Chinooks in Alberta, Atmosphere, 5:4, 4-16
 |
| Richmond W. Longley (1967) The frequency of winter Chinooks in Alberta, Atmosphere |
Longley hints at what I'm interested in - we might not get the same warm extremes as the southern part of the province, but we get something. Is it enough to be called a chinook? That paragraph mentions three different temperature ranges:
- 50°F (10°C) - the real chinooks of southern Alberta
- 40°F (4.4°C) - a compromise, where at least there will be some melting
- 30°F to 35°F (-1°C to 1.6°C) - nice enough, but not really something you write folktales about
Here we have the number of days above 2°C, 5°C and 10°C for December-February going back to the 1880s.
For days above 2°C we get between about 15 and 30 days. There have been some low years like 1992-1993 which only had 1, but also years like 2011-2012 with 39, and last winter with 34.
For days above 5°C we get between about 5 and 15 days. And days above 10°C are fairly rare, with many years that don't have any during December-February.
To get a better sense of the trends, here is the same data with the 5-year averages added as dotted lines:
Looking at the averages, during December-February we get about 23 days above 2°C, and about 10 days above 5°C. Those three coldest months of the year have 89 days (90 in leap-years), and so we break 2°C about 25% of the time, and for 5°C it's about 11%.
One thing that stands out here is that the number of days above 10°C has dropped off in the last 100 years - the average used to be 2 or 3 days per year, but now it's down below 1. We actually saw this before, in one of my earliest posts.
Whenever I see strange numbers from a century ago I start to question the data. Edmonton has had a few weather stations over the years (which I talked about here). The first switch happened in 1937, and looking at this chart 1937 is about the point where the frequency of those 10°C days really drops. And when I'd compared the data from the stations, I'd found that the oldest 1880-1937 station was more variable than the newer ones. So it's possible that in the olden-days we really did get more warm days in December-February than we do today, or it's possible that the older data was a little less precise. For now, we'll leave it as a mystery.
If days above 10°C are a little bit hit-or-miss nowadays, then what is the warmest temperature that we do reliably get in December-February?
Here we're looking at the number of warm days each December-February, going back to 1995.
We can see that we get days above 10°C about half of the time, and some years get two or three of them. Days above 8°C or 9°C are a little more reliable - almost every year has had an 8°C day. But days above 7°C are the only ones that we should really count on, because every year since 1995 has had a least one, and in many cases several.
So going back to Richmond Longley's definition of a chinook, for December-February we don't really see many days in the 10°C range, but 5°C and 2°C are pretty reliable.
Day-over-Day Temperature Changes
Looking at warm winter days is all well and good, but it seems to me that chinooks should be sudden. It's not just about the warm temperatures, but also about the rapid shift from cold to warm. So next we are going to look at how the temperature changes from one day to the next.
Last year a blogger from Calgary named Matt Chernos looked at chinooks in this post: Are the number of chinooks increasing (in Calgary)? Matt mentioned the same difficulty of finding a quantitative definition of a chinook, and he ended up using three measures:
- daytime high of at least 5°C, with a day-over-day increase of at least 5°C
- daytime high of at least 8°C, with a day-over-day increase of at least 5°C
- daytime high of at least 2°C, with a day-over-day increase of at least 7°C
One thing that I do like about the previous warm-days approach was restricting it to December-February. Not that chinooks can't happen in November (we just had a nice, big one this year) but November & March both have plenty of days that are naturally going to be warm, and counting those as chinooks seems like cheating. I want to look for truly unusual temperatures, so I'm going to stick to the real depths of winter.
This chart is a mess, so I'll talk about it really quickly and then move on.
This shows the number of these "chinook" events each year: blue is days with a high of at least 5°C and a day-over-day increase of at least 5°C; green is 8°C with a 5°C increase; and red is 2°C with a 7°C increase.
The data is really noisy though, so lets look at the averages to smooth things out:
And hopefully that's a little clearer. The same mess of data is still shown in the background, but now the 5-year averages have been added on top.
Here we can see that the red and blue lines for temperature jumps up above 2°C and 5°C are fairly close to one another, averaging 3~4 events each year. And the green line for jumps above 8°C is lower, at around 1 per year.
One thing to remember is that here we're looking at chinook "events" - how many times the temperatures jumps up - while in the first chart today it was the total number of warm days. So here we see that in a typical December-January the temperature will jump above 5°C three times, while the earlier charts showed that we would spend a total of 10 days above 5°C.
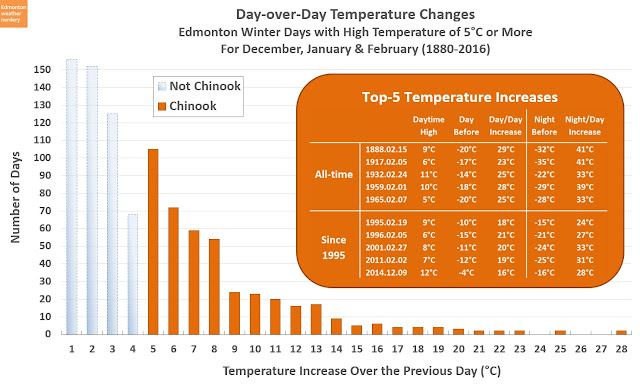
This is the breakdown of the highs above 5°C, and how much the temperature had increased over the previous day. In a lot of cases we can see that the temperature jump was at the 5°C cut-off or less, but there are some days with swings of 10°C, and even a few of 20°C or more.
Getting back to the idea of folklore, the 5 largest temperature swings are shown here. I've broken this list into the Top-5 of all-time going back to the 1880s, as well as the modern ones going back to 1995. We can see the 20°C+ swings in high temperatures, and several of the corresponding night-to-day temperature swings are more than 30°C. That's impressive enough that you might tell stories about it for a few years. (although I have to admit that I have no particular recollection of either February 2nd, 2011 or December 9, 2014).
Scorecard
Here is Edmonton's chinook scorecard for December-February based on just the last 10 years.
So...does Edmonton get chinooks?
If we're only talking about the summer-in-January days above 10°C, then there are some years with one or two, and others with none. But surely all of the days that we get above 2°C and 5°C must count for something?
For today, I'll leave the question open. But next week in Part 2 we'll look at things from a different angle, and will hopefully come up with an answer.


No comments:
Post a Comment