
- Frost-Free Days: Part 1 where we looked at how long Edmonton's frost-free season is, and at how it has changed over the last century.
- Frost-Free Days: Part 2 - versus Round where we compared Edmonton's frost-free season to surrounding areas, and to a few other Canadian cities.
Most of the background information today is sourced off of wikipedia; the United States government site planthardiness.ars.usda.gov; and the Canadian government site www.planthardiness.gc.ca. I could certainly never claim to be an expert on this subject.
USDA Minimum Temperatures Zones
In 1960 the United States Department of Agriculture (USDA) apparently (according to wikipedia) created the first modern horticultural zones, which are geographically defined areas in which a specific category of plant life is capable of growing.
Here is a very pretty map which is the result of that:
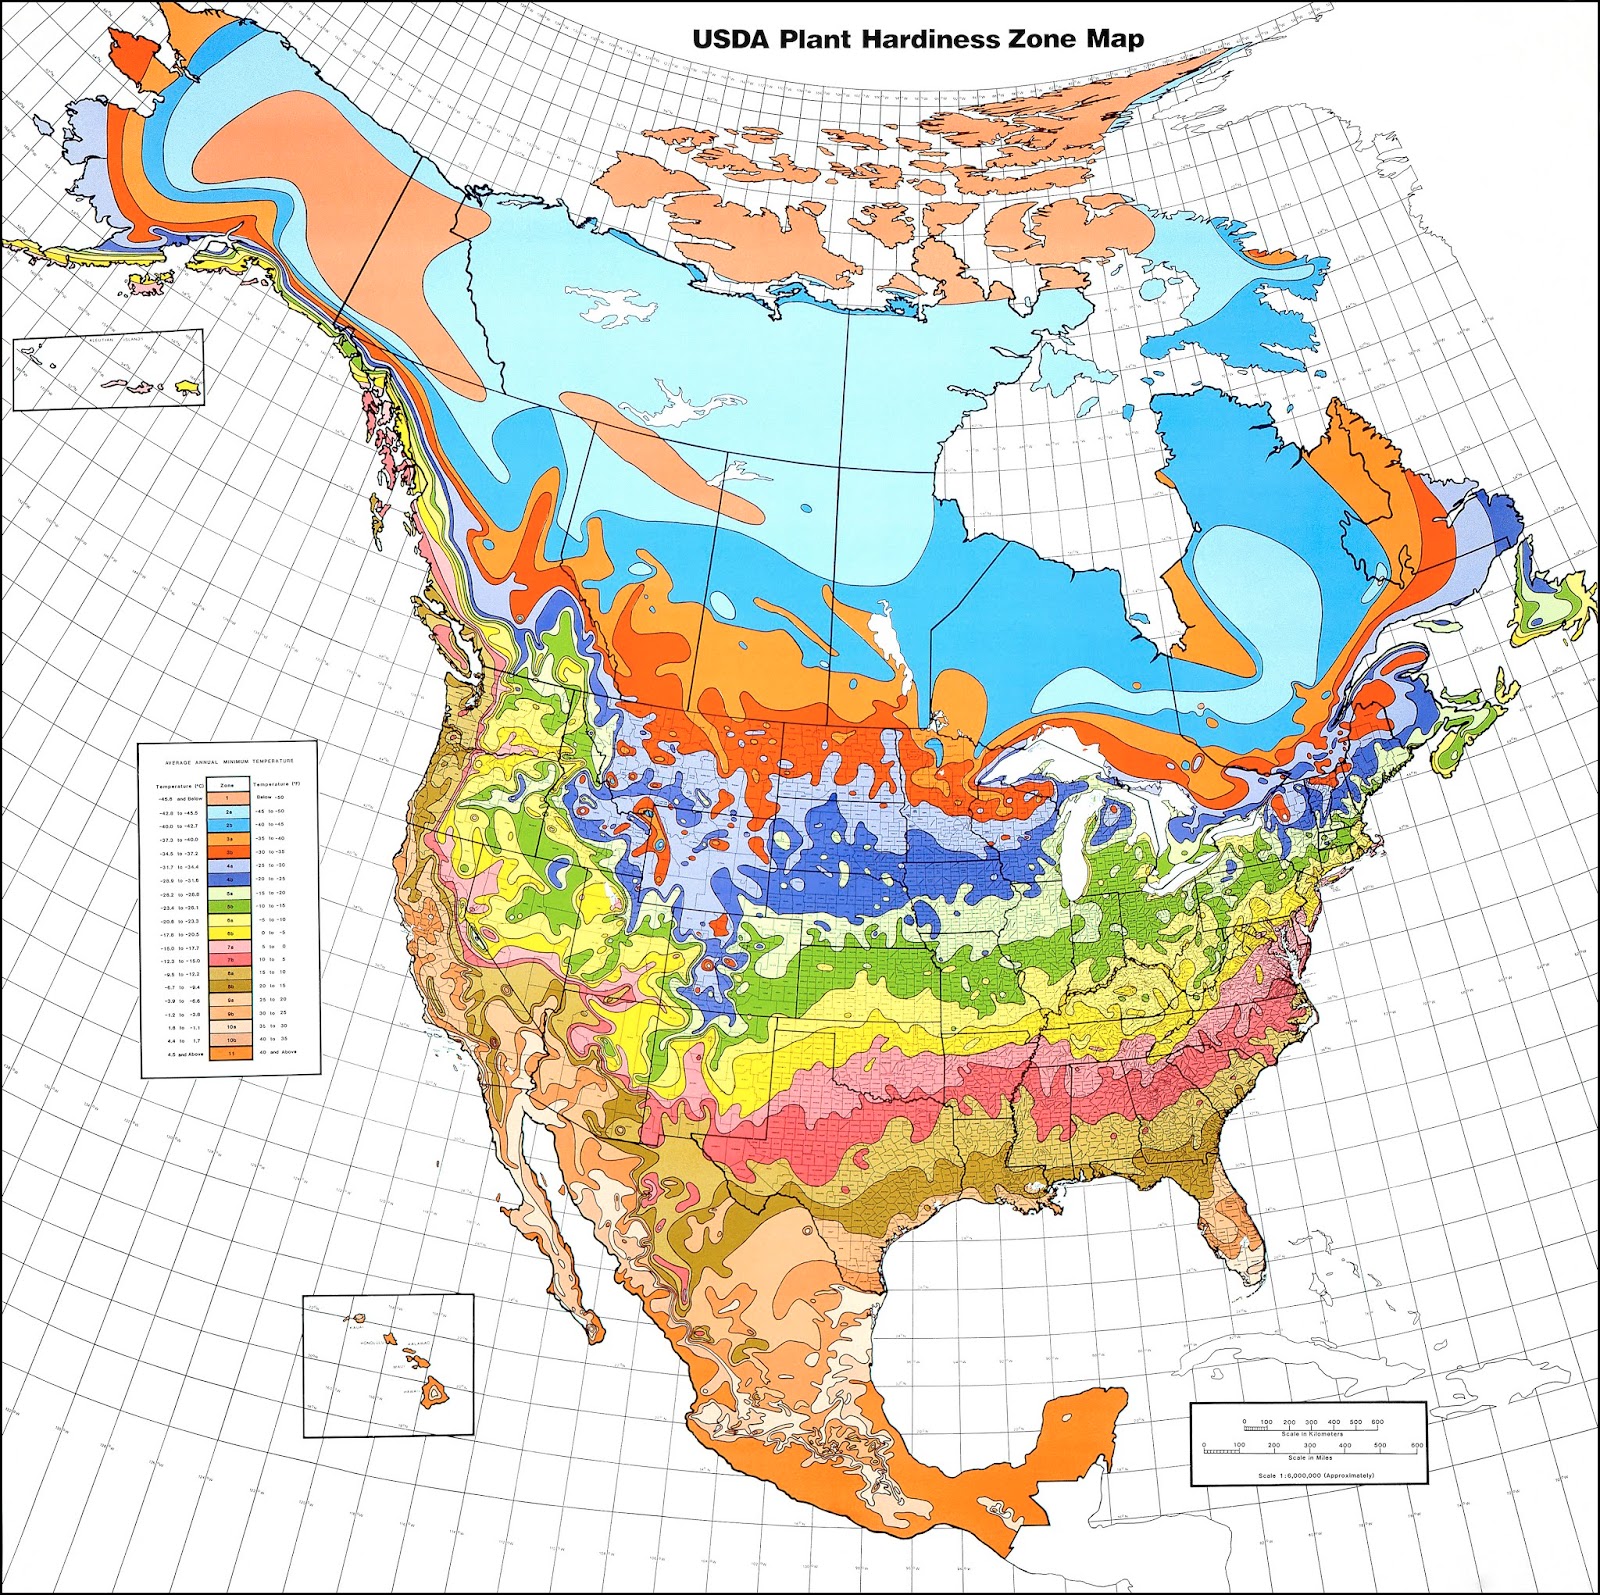 |
| Source: wikipedia |
The USDA uses one simple trick to determine these zones: the minimum temperature experienced each winter. And so here are the minimum temperatures each year for the Blatchford weather station in Edmonton:
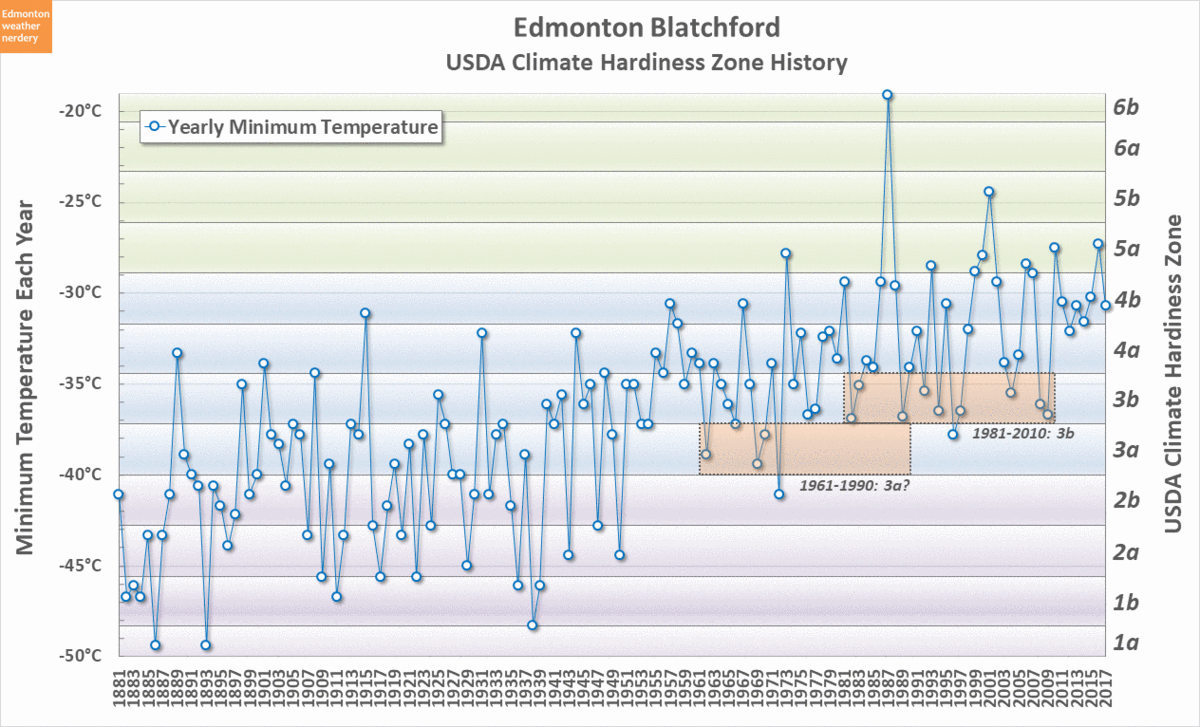
Because the USDA Zones are American the data for Canadian locations is a little bit spotty. The Canadian government site has interactive maps for the USDA zones for 1961-1990 and 1981-2010, and both of those appear to show Edmonton as 3b for both timeframes. But the big, colourful map we just looked at shows Edmonton as 3a? So for the "official" zones in this chart we've chosen to use 3a from 1961-1990 and 3b from 1981-2010, and those sections are highlighted in orange.
The hardiness zones are relatively recent, and so we don't know what Edmonton's "official" zone would have been 100 years ago. But up to 1950 we fairly frequently had lows down into the 1b and 2a range. Since 1950 we've only dropped to 2b once, with a minimum of -41.1°C in 1972. And since 1972 we've only dropped into 3a once, with a minimum of -37.8°C in 1996.
Recently our official zone has been 3b, and since then we've only had 5 years that got that cold: the previously mentioned 1996, as well as 1997, 2004, 2008 & 2009. The other 17 years have been a mix of 4a, 4b, and 5a, with 2001 as an outlier up at 5b. And going a bit further back, 1987 was a major outlier up at 6b.
The dotted line in this chart shows the 30-year average yearly minimum temperature, and in the last century it has increased by 10°C from -41°C to -31°C. But, as we've seen before (most recently in Frost-free Days: Part 2)- the Blatchford station is often milder than the rest of the region. These climate zone maps are very broad, so how well does it match some rural stations?
USDA Zones - Outlying Areas

This chart has the yearly minimum temperatures for Blatchford, for my 3 favourite rural stations Calmar, Campsie & Sion, and for the Edmonton International Airport.
There is undoubtedly too much going on in this chart, but I didn't want to spend a lot of time separating it out, so lets just focus on the important parts:
- We just saw that since about 1950 Blatchford has pretty solidly been in the 3b and 4a range. And its 30-year average minimum yearly temperature increased -41°C to -31°C from 1910 to today.
- Calmar in red is mostly in the 2b or 3a range, but in the 1970s and late-1990s it had some years that dropped into the 2a and even 1b range. It's 30-year average increased from -43°C to -38°C from 1945 through 2007.
- The Edmonton International in orange is right next to Calmar. It is also mostly in the 2b or 3a range, and also had some much colder years. As recently as 2009 it dropped into the 1b range with a low of -46.1°C. It has less data than the other stations here, and its 30-year average has only increased from -39°C to -38°C from 1990 through 2017.
- Campsie in green is the furthest of the stations at 100km northwest of Edmonton, and it's also the coldest. From 2000 to the end of the data in 2013 it had 3 years in the 1b range with lows below -45°C: 2004, 2008 and 2009. More typically it's in the 2a and 2b range. From 1940 through 2013 it's 30-year average increased from -45°C to -41°C.
- Sion in purple is fairly similar to Blatchford, sitting mostly around 3a and 3b. A -41°C in 1996 dropped it into the 2b range though. From 1940 through 2004 it's 30-year average increased from -43°C to -35°C.
The climate zone map that we looked at above has broken North America up into very broad areas. But here we've see that even within a small area like the Edmonton region there is significant variation. The "official" USDA zone of 3b is probably a pretty good match for Blatchford, although it might be a bit on the conservative side of things. But at the International Airport 3b is maybe a bit optimistic, because since 2000 there has been 1 year in the 2b range, 2 in 2a, and 1 in 1b.
USDA Zones - Calgary, Winnipeg and Montreal

Here we're taking another look at the USDA Minimum temperatures zones, by adding Calgary, Winnipeg and Montreal.
- Calgary's official USDA zone is 4a, although in 1997 it dropped to -39.7°C which is in the 3a range. Over the last century its 30-year average yearly minimum temperature increased from -37°C to -31°C, compared to Edmonton's shift from -41°C to -31°C. So right now the averages are close, although Edmonton has had a few more recent 3b years than Calgary.
- Winnipeg's USDA zone is 3b, which is the same as Edmonton. It has had a few recent years - 1996, 2004, 2007 - down in the 2b range. Its 30-year average has increased from -41°C (where Edmonton started) to -36°C compared to Edmonton's current -31°C.
- Montreal's USDA zone is 4b, although its minimum temperatures are more often in the 5a or 5b range. Its coldest recent year was 1994 which dropped to -31.8°C right at the bottom of the 4b range. Its 30-year average has increased a bit from -29°C to -26°C.
One thing to keep in mind here is the stations which are being used: Edmonton's is downtown~ish; Calgary's is on the edge of the city; Winnipeg's is on the edge of the city~ish; and Montreal's is the furthest from downtown, but it is surrounded by city, and it is near the St. Lawrence.
We saw that temperatures within the Edmonton region vary greatly, and that might explain why Edmonton and Winnipeg officially share the same 3b zone, but the data here makes them look quite different. And also why Calgary is a zone higher than Edmonton, but the data here looks quite similar.
One other thing to remember is that this chart just shows the single coldest day each year. And so while those very-coldest days have been getting less cold, this isn't necessarily indicative of overall warming. Overall warming was something we looked at a bit recently in the Winter City Showdown, most notably in this chart.
Canadian Plant Hardiness Zones
While looking at the USDA zone data you might wonder if the coldest temperature each year really provides enough information to determine whether a plant will survive in a location? The Government of Canada apparently doesn't think so, and so it uses a much more elaborate calculation.
It's easiest to let them explain it:
 |
| Source: www.planthardiness.gc.ca |
The short version of all of that is that the Canadian zones use a score based on 7 different factors - cold winter temperatures, frost-free days, summer rainfall, hot summer temperatures, January rainfall, snowdepth, wind gusts - and that score corresponds to a zone. Here is the result:

The Canadian zones are calculated very differently from the USDA zones, and for our example cities there are some similarities and some differences:
- Edmonton: USDA 3b - Canada 4a
- Calgary: USDA 4a - Canada 4a
- Winnipeg: USDA 3b - Canada 4a
- Montreal: USDA 4b - Canada 6a
We'll dig into this a bit starting with Edmonton:

This chart shows the Canadian Hardiness Index calculated each year for Edmonton. The official zones are averaged for 1961-1990 and 1981-2010, and the yearly line nicely crosses through the middle of them.
The numbers behind this chart are not straightforward, so lets take a look at where the scores come from, referring back to the big, 7-part formula that we saw earlier:

From 1910 through 2010 the calculated index increased from 28 (which would be zone 2b) to 44 (4b), and this table shows how much each of the 7 factors contribute to that score. We don't want to get too hung up on the individual numbers (like the Mystery Coefficient of -67.62) because those are just part of the formula that Oellet and Sherk developed. What's more interesting is where the score come from, and what has changed.
Edmonton's score has increased by 16 points, and that is almost all due to 2 factors: the Cold Winter Temperatures (gained 10 points), and the Frost-Free Period (gained 6 points). The other factors are flat, or they don't have much of an impact. And for Maximum Snowdepth and Wind Gusts the data doesn't go all the way back to 2010, so for those I've used modern data, but either way they don't have a huge impact on the total.
With all of that said, the chart seems to be a pretty good match for the official numbers. The yearly line passes right through the middle of the 1961-1990 and 1981-2010 ranges, and it seems like Blatchford is on its way up into Zone 4b.
Lets take a look at a few other cities:
Canada Zones - Calgary, Winnipeg and Montreal

This chart shows the calculated Hardiness Index for Blatchford and the International Airport in Edmonton, as well as for the Calgary, Winnipeg and Montreal airports.
- For Blatchford we've seen that this calculation is a pretty nice match for Edmonton's official zone of 4a, but for the Edmonton International (in orange) it isn't even close. The International's line sits way down in the 3a range. The official zone for Leduc is 3b for both 1961-1990 and 1981-2010, and even compared to that the calculation is still low.
- For Calgary the calculation is a bit below the official 3b zone for 1961-1990, but for 1980-2010 it's into the official 4a range.
Calgary's yearly line actually drops from 1945 to 1980, and the two factors which cause that are the Monthly Mean of the Daily Minimum Temperatures of the Coldest Month and the Monthly Mean of the Daily Maximum Temperatures of the Warmest Month. The other 5 factors - snowdepth, rain, etc - stayed relatively stable.
This chart shows the cooling of Calgary's warmest and coolest months (which isn't necessarily reflective of an overall cooling - this chart covers that), which is something that we didn't see in Edmonton. In the past I've mentioned that Calgary's weather station probably moved to its current location at the airport sometime around the 1950s, and this might be evidence of that? That's just a theory though. - For Winnipeg the 1961-1990 zone of 3a is close to the calculation. But for 1980-2010 Winnipeg's official zone took two steps up to 4a, and the calculated values do not move along with it. The numbers for the Winnipeg International are about the same as the Edmonton International, down in zone 3a.
- And for Montreal the calculated numbers are reasonably close to the official zones. For 1961-1990 the calculation is a little bit above the official score, and for 1980-2010 it's a bit behind. Like we see with Calgary, Montreal's calculated score also dropped from about 1940 to 1985. For Montreal the two factors which caused this drop were Monthly Mean of the Daily Minimum Temperatures of the Coldest Month and the Frost-Free Days (which we saw here).
It's also worth noting that for Edmonton, Calgary and Winnipeg the official zones are fairly close for both the USDA and Canada calculations. But Montreal jumps from 4b for USDA all the way up to 6a using the Canadian zones.

Just a few finale caveats for this chart before we wrap up for the day:
- The Canadian calculation needs data for all 7-factors to work, but snowdepth records only go back to about the 1950s, and Wind Gust data is incredibly spotty. So just to get any result means making some approximations and substituting in a bit of modern data.
- When the numbers don't add up - as with the Edmonton International and Winnipeg - it's tough to identify which of the 7 factors is causing the discrepancy. I've checked and double-checked the data for those stations, and I can't get anything close to the official 1981-2010 Zones.
And for Blatchford, Calgary and Montreal, even though the calculations look pretty good I can't be sure if that's because it is actually correct, or if the 7 factors just combined in a way that doesn't look spectacularly wrong. - The formula for these climate zones was introduced in 1967, and it's possible that it was never intended to be used with earlier data? Regressions can be finicky, and if Oellet and Sherk didn't originally include 1880-1940 then the coefficients might not be calibrated for those years.
- And I'm also not sure that this formula is really meant to be used with data for individual stations. The government has created zone maps for each of the individual factors - X1, X2, X3, X4, X5, X6 & X7 - and using those would smooth out the discrepancies between Blatchford and the International. But it's still interesting to see how the data from the individual stations compares to the official results.
Summary
Today we looked at the 2 main methods of determining Climate Zones in North America. The USDA zones are very simple to calculate because they just use the coldest temperature each year, while the Canadian approach is much more complicated and uses 7 different factors.
Using both types of zones we saw that Edmonton Blatchford has been increasing: by 1 or 2 zones in the last 50 years, and by 2 or 3 in the last century. But we also saw that the Edmonton International is 1 or 2 zones below Blatchford. So if you live near Blatchford the official zones are probably a little conservative, which should give you some room for gardening experiments. But if you're closer to the International Airport (which is really cold) the zones might be giving you a false sense of security - many years will be fine, but occasionally a -46.1°C will come along like in 2009.
With today's post, as well as Frost-Free Days Part 1 & Part 2 we now reach the end of our trip into the world of gardening. It's been fun, but these have all gone really long, and it will be nice to get back to talking about plain, old, boring, weather again.
No comments:
Post a Comment