
This continues Edmonton Weather Nerdery's ongoing look at all-things-snow:
(I think we're finally getting close to the end)
The snowdepth measurement is a bit weird though, so we'll start with a few caveats.
Caveat #1: It's All Relative
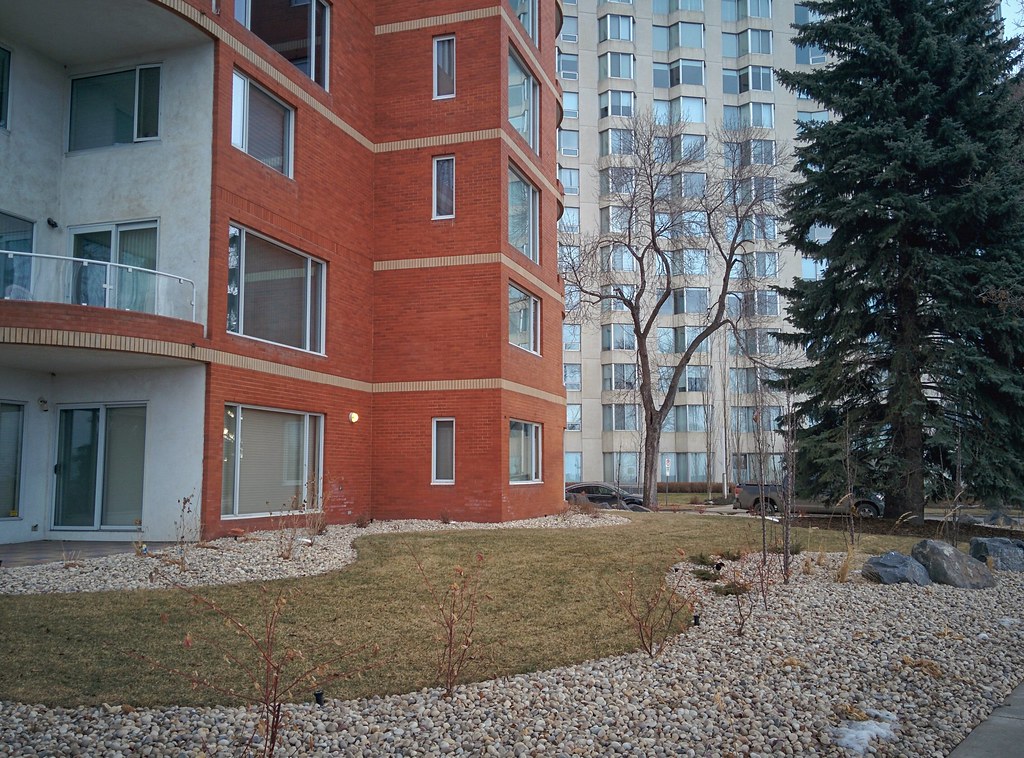 |
| January 28, 2017. And yes, that's Edmonton |
And that's not even very unusual, because for the 4 winters that I've lived nearby it has always had large patches of exposed grass during either January or February.
There are a few contributing factors: warm underground parkade, southern exposure, and I think there's an important windtunnel effect coming off of the river. But even compared to similar buildings a block away, this building and a few of its neighbours always lose their snow first.
I mention this, because snowdepth is obviously going to be very dependent on location. Today we'll be looking at Environment Canada's snowdepth data for the International Airport, and that won't necessarily be a great match for a downtown apartment building, or a spot in the shade, or a boulevard with a winter's worth of snow piled on top of it.
So today will be less about the specific numbers, and more about how different winters compare to one another, and how snowdepth changes over the course of a winter. The word for the day is "relative."
Caveat #2: The Data
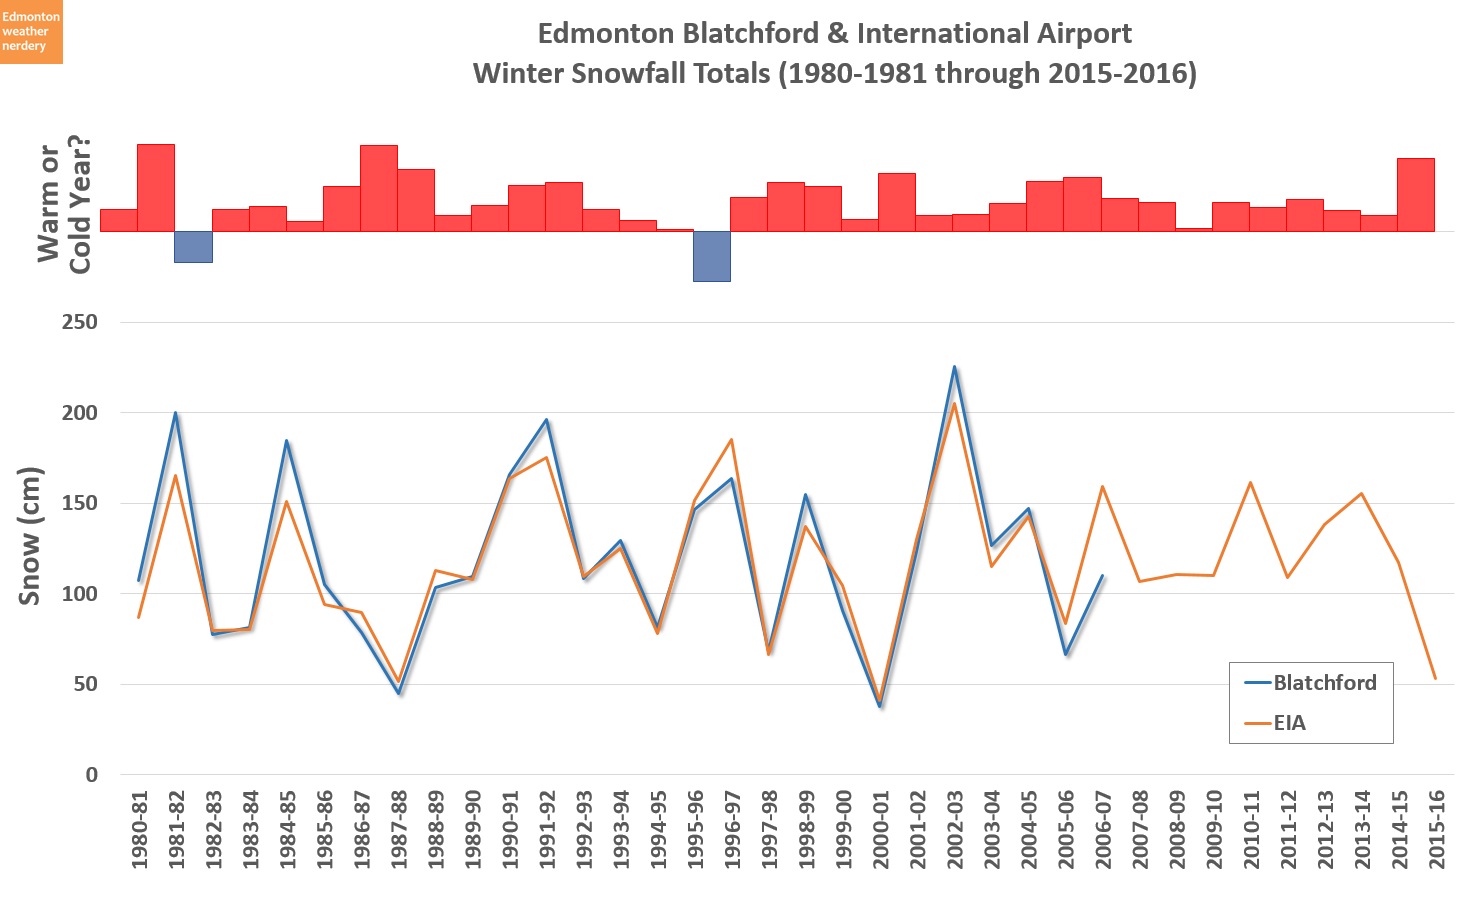
Today we're going to look at data from the International Airport, because Blatchford has no data from 2007-2015. But Blatchford's data also has other problems, like this:

Environment Canada's records for January 2017 at Blatchford show that the snowdepth jumped by almost 10cm on January 12. Except that in reality there was definitely no giant blizzard on that day. And later in January we had two don't-call-them-chinooks which caused a lot of melting, but Blatchford's numbers don't reflect that.
So this Blatchford data is obviously wrong, but the only reason that I recognize that it's wrong is because it just happened.
We won't be using the Blatchford data for anything today, but the data for the Edmonton International might have similar errors in it, and I would never know. The International does have a bunch of suspicious 0's - a snowdepth of 20cm one day, 0cm the next, and then 20cm again the day after - and I've tried to correct those. But there could be other problems hidden in the long forgotten decades.
Even with those caveats though, I still want to know about snowdepth, so lets see what we've got:
Snowdepth on February 1st

February 1st is a nice midpoint for the winter, and this year we were sitting at 9cm (and since then we've crept up to 13cm). Going back to 1961, that put us in 8th lowest place overall.
While I don't necessarily have huge faith in the absolute numbers here, the lowest recorded snowdepth was essentially 0cm in 2006, and the two highest were 58cm and 66cm in 1974 and 1971. Those two highs are pretty big outliers compared to any of the other years.
Our average snowdepth for this time of year is about 20cm, although that can swing pretty wildly from something like 5cm in 2012 to 38cm in 2011. Looking at the 5-Year average we've been a bit on the low-side over the last few years, but the late-80s were more consistently low (and once again, that is not how I remember things at all).
February 1st is just one point in time though, so next lets look at how things change over the whole winter. 50 years of data is a little overwhelming, so for this we'll stick to more recent history.
Snowdepth since 1995

Here we have the snowdepths over the course of a winter, going back to 1995-1996.
We've seen before that we don't usually get lasting snow until November, and here we can see that the snow mostly disappears by early April (at least according to Environment Canada's measurements).
Snowdepths in the last three winters have all been pretty low, but before that 2010-2011, 2012-2013 and 2013-2014 were all pretty substantial.
If we roll each of those individual years into my typical average/quartiles/max/min format we get this:
Average Snowdepth

In the background here the average snowdepth for each day of the winter is shown by the solid, white line. Surrounding that in the darker blue area are the 25-75th percentiles, which is where we'll be about 50% of the time. And then outside of that are the highest, second highest, lowest, and second lowest totals recorded since 1995.
For 2016-2017 we had the surprisingly large snowfalls in October, which melted fairly quickly. Then a storm in mid-November pushed us up to the average, although that really only applies to the airport. On November 15 & 16 it got 9cm of snow, but that snow completely missed the city. Back when we'd looked at yearly snowfall totals we saw that over the course of an entire winter Blatchford and the International were usually pretty close, but certainly there will be some storms that hit one location and not the other.
We saw up above that individual years are pretty variable, but on average the snow starts piling up in November, and the snowdepth climbs throughout the winter until the beginning of March. At that point the average starts to drop, and by the time we hit late-March it's in freefall.
Snowdepth vs. Total Snowfall
One thing to keep in mind is that snowdepth is not the same as total snowfall.
This chart tries to show how snowfall and snowdepth compare. Basically: snowfall dwarfs snowdepth. The winter of 2016-2017 is a good example of that difference, with a lot of our snow falling in October, and then quickly vanishing.
In a typical winter we get between 100cm and 150cm of snow, but the maximum recorded snowdepth since 1995 was only 53cm. And since the records started in the 1960s, the maximum snowdepth ever recorded was 84cm in March of 1974. 84cm is pretty deep snow (the second most was 66cm in 1971), but that's a record amount, and it is still only about half of the total snowfall that we would get in any typical year.
I might do another post later on looking at how snowdepth actually relates to snowfall, but for now I assume it's some combination of:
- snow compresses over time
- the deeper or heavier the snow, the more it compresses
- snow melts during our reliable mid-winter warmspells
- snow at the beginning and end of the winter quickly disappears
The spring is interesting, because during March-through-May we average about 40cm of snowfall, but the snowdepth usually starts to flatline in early March. Spring snowfall is about 1/4-to-1/3 of our total for the year, but it doesn't add up to much on the ground.
No comments:
Post a Comment