
Today we're going to look at a third northern, prairie city: Winnipeg.
Winnipeg has two main Environment Canada weather stations: one located at the Forks in the downtown, and the other at the International Airport. That should be a good thing, except that the data for the Forks only goes back to 2000, while normally for these comparisons I've been using 1995 to give a nice 20-year range. But in the interest of providing as complete a picture of Winnipeg weather as possible, today I'll be using both the stations, and we'll only be looking at 2000 onward.
As I did with the Calgary comparisons, here I'll be taking my standard rollercoaster chart which shows how Edmonton's temperature varies throughout the year, and overlaying the Winnipeg data on top of it.
Daily Highs

In the background here we have Edmonton's recent history of high temperatures for each day of the year. It's a chart that I use all of the time, but it could use some explanation:
- The white line in the centre is the average temperature based on all the years from 2000 through 2016.
- Surrounding that average is a grey band for the 25-75th percentiles, which is where temperatures will fall roughly half of the time.
- Finally, the oranges and blues are the warm and cold extremes recorded between 2000 and 2016.
We'll look at this in more detail later on, but just generally we can see that in the summer Winnipeg's highs are a few degrees above Edmonton's, and in winter they are several degrees lower. The crossover happens around April, and then again in October.
Daily Lows

Here we have the daily low temperatures for the year, and this one is a little bit harder to read because there is a noticeable difference between the International (green) and the Forks (purple). For the entire year, the lows at the Forks are consistently a few degrees above the lows at the International.
To make things a little less busy, here are the International and the Forks broken into two separate charts:
Daily Lows - Winnipeg International


And with both of those charts, the story is similar to what we saw for the high temperatures: in the summer Winnipeg's lows are a few degrees above Edmonton's (or about the same for the International), and in winter they are several degrees lower.
Doing these comparisons in terms of the whole year is a little tough to interpret, so now lets break things down into summer and winter. And we'll add Calgary into the mix as well:
Summer Highs

So here we're focusing on the daily high temperatures during just the summer months. Calgary has been added in red, and once again the highs for the Winnipeg International and Forks are similar enough that it is hard to tell them apart.
Edmonton and Calgary are pretty similar - Edmonton is a little warmer in June, and Calgary is a little warmer in July. But compared to both of them, Winnipeg's summer days are consistently 2-3°C hotter.
Looking at the maximum temperatures for Edmonton in orange, there are plenty of days in July and August where Edmonton has not recorded a temperature above 30°C during the last 15 years. That is not the case for Winnipeg though, where almost every day from June through mid-September has broken 30°C at least once since 2000.
Summer Lows

For the summer lows things diverge a bit. The Winnipeg International and Forks are no longer a perfect match, with the Forks staying 2-3°C warmer overnight. The lows at the Winnipeg International are a fairly close match for Edmonton, and in this case Calgary is a few degrees cooler than all the others.
It's a little tough to see, but Winnipeg's range of summer low temperatures - shown by the faint dotted lines - is quite a bit larger than Edmonton's. In some cases the maximum is 5°C higher, while the minimum is several degrees below. Using mid-July as an example, Edmonton's overnight lows mostly fit in a fairly narrow band from about 10°C to 18°C, whereas at the Forks the range is more like 7°C to 23°C.
Winter Highs

Here we have the winter high temperatures, and again the Winnipeg International and Forks are a pretty close match, with the Forks being just a touch warmer.
Edmonton and Winnipeg are fairly similar through November, but Winnipeg drops off in December, and then again in January. And Calgary is consistently the highest for the whole period.
Just eye-balling off the chart, during the depths of winter in January and February the highs in Calgary average around 4°C warmer than in Edmonton, and Edmonton is about 6°C warmer than Winnipeg. And with that gap, the average highs for Calgary are actually a pretty close match for Winnipeg's 15-year maximum.
Winter Lows

And finally, here are the winter lows.
Here the two Winnipeg stations have separated again, with the International getting about 2°C colder than the Forks. For November and December the Winnipeg lows are fairly close to Edmonton and Calgary, but then things drop off in mid-January. There's a roughly 7°C gap between Blatchford and the Forks, or 10°C between the Calgary and Winnipeg Airports. And that gap hangs around for a long time - almost until the end of February.
In Edmonton, I've come to really appreciate spending time outside in January and February, because compared to November and December things are relatively sunny and warm. But in Winnipeg it looks like January and February are definitely the coldest part of the winter. And looking at the dotted lines for the 15-year minimum, there are some pretty big gaps between the coldest recent days for Edmonton and Winnipeg.
Looking more closely at Winnipeg's coldest temperatures for the past 15 years - the faint dotted purple for the forks, and green for the International - we can see that in January and February there's a significant gap between the two. The International has dropped below -40°C a few times, while the forks has mostly stayed above -35°C.
With these various weather stations, which stations are the "right" ones to compare?
The Forks is right next to downtown Winnipeg, and on the rivers. Comparing that to Edmonton, a similar location would probably be somewhere in Rossdale. But there is no Rossdale weather station, and so instead the Edmonton data comes from Blatchford, which is an airport 4km north of downtown.
Environment Canada doesn't have a central weather station for Calgary, so here I am using the Calgary International airport, which is about 8km north of downtown. And the Winnipeg International Airport is slightly more central than that, at about 7km east of downtown. (I haven't included the Edmonton International, because at 26km from downtown, it plays by its own rules. I did talk about it a bit in the Calgary comparison, though)
So all told, the Winnipeg and Calgary airports are probably pretty good comparisons for one another. If Calgary did have a central station, its low temperatures might bump up by a few degrees, like we see with the Forks. And as a reference point Edmonton Blatchford likely falls somewhere between the two Winnipeg stations.
Precipitation
Finally for today, we'll take a quick look at precipitation. These will be using a few of the standard charts that I have set up for Edmonton, but with data for the Winnipeg International overlaid on top (I'm not including the Forks this time).
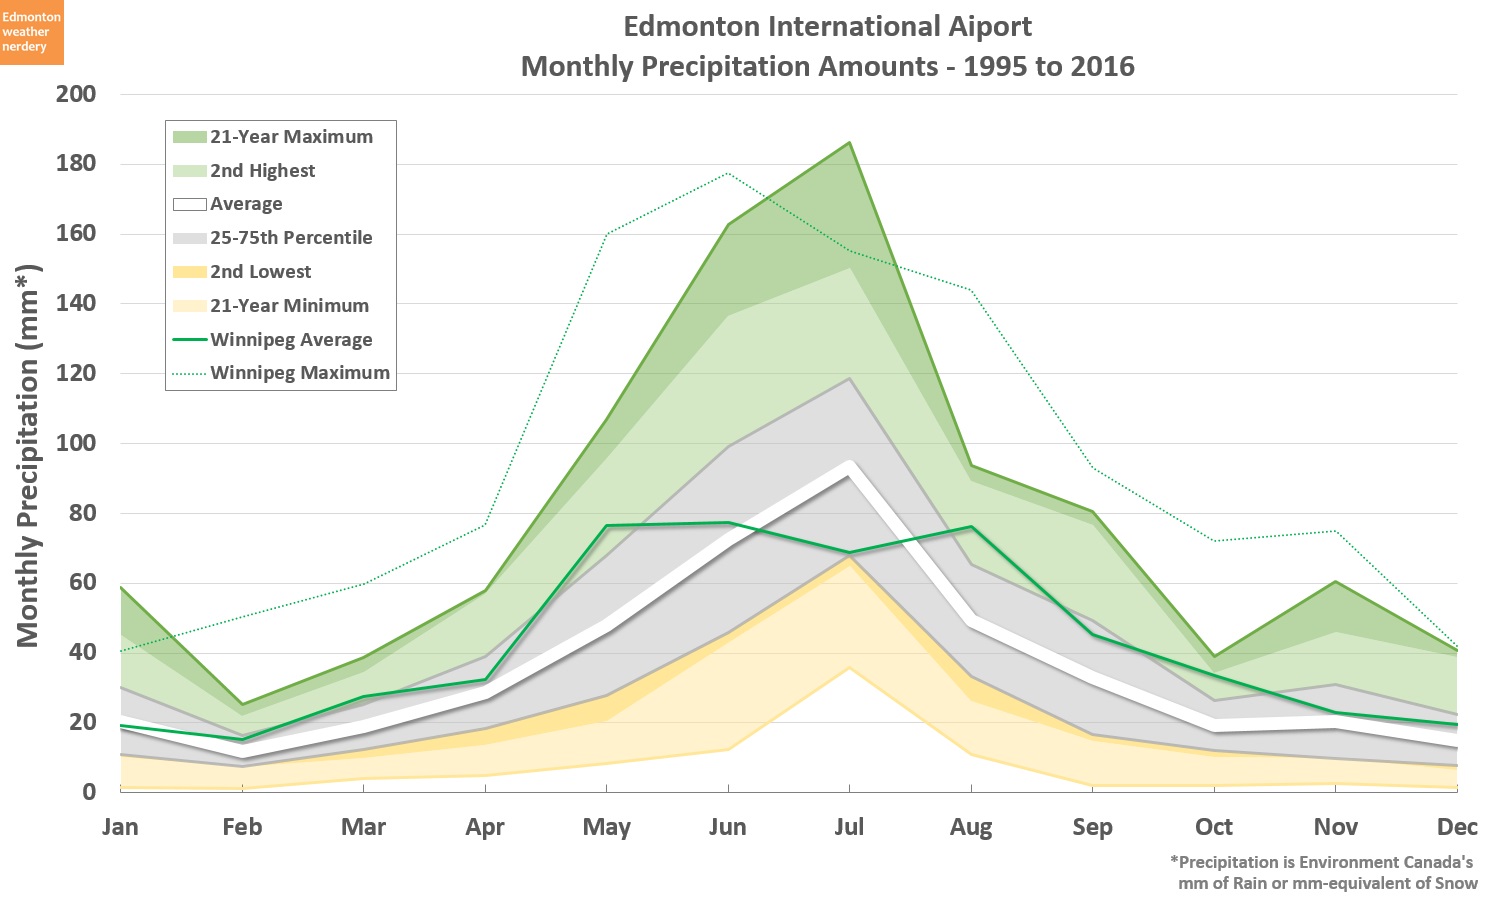
Here we have yearly precipitation broken down by month.
In terms of averages, Edmonton and Winnipeg are very similar for November through April. But then it looks like Winnipeg has a really long, consistent monsoon season from May through August, while Edmonton's is really just late June and early July. After July Edmonton's precipitation drops off, while Winnipeg's stays comparatively high through to October.
Breaking it down by month it's tough to see how the two cities compare overall, so here is the yearly data:

So with all of that said, I'm not sure if there are any surprises?
- Winnipeg's summers are a few degrees hotter than Edmonton or Calgary.
- Winnipeg's winters are several degrees colder than Edmonton, which is a few degrees colder than Calgary - in terms of surprises, I guess I wasn't expecting January and February to be quite so different from Alberta.
- Winnipeg's precipitation is 15~20% higher, which I probably wouldn't even notice.
I've called this Part 1 of the Winnipeg comparison, although I don't actually have a Part 2 planned. But I'm sure that there will be one at some point.
No comments:
Post a Comment